Water Utilities: The Untapped Potential of AI for Pipe Network Management
Australian water utilities manage over 139,000 km of aging mains and thousands of kilometres of process piping. Discover how AI, Monte Carlo simulation, and bow tie risk assessment are transforming pipe failure prediction and risk-based asset management for water infrastructure.

.jpg)
Australia's water utilities manage over 139,000 kilometres of water mains. Every year, those pipes produce roughly 26,700 breaks and leaks — and the total cost of corrosion alone runs close to $1 billion annually. Here's the uncomfortable truth: much of this infrastructure was laid before the 1970s, designed to last about 50 years. Do the maths. We're already past the use by date on a significant portion of our buried network, and replacement rates aren't keeping up.
But buried mains are only half the story. Above ground, water treatment facilities contain thousands of kilometres of process piping, classified under Australian Standards AS 4041 and AS 4343, carrying everything from drinking water and brine to sulphuric acid and sodium hypochlorite. This piping is subject to its own failure modes, its own regulatory requirements, and its own data challenges. And it's been largely overlooked in the AI conversation.
The good news? AI and advanced analytics are starting to change how utilities think about pipe management across both domains. Not as a futuristic concept, but as a practical toolkit that's already delivering results where it's been applied properly. The challenge is that adoption across Australian water utilities remains stubbornly low.
The Unique Challenge of Buried Assets
Water pipes are among the hardest assets to manage in any infrastructure portfolio. Unlike a pump station you can walk through or a treatment plant you can visually inspect, buried mains sit under roads, footpaths, and private property, often for decades without anyone laying eyes on them.
This creates a perfect storm of asset management difficulty. Lifecycles stretch from 50 to over 100 years depending on material and soil conditions. Condition assessment is expensive, disruptive, and often requires shutting down supply. And the consequences of failure range from minor inconvenience to major public safety events and millions in damage.
In practice, most utilities still operate reactively — they fix pipes when they break and replace sections only after repeated failures. It's the industry's dirty secret: for smaller reticulation mains, run to failure is still considered acceptable practice. That might have worked when the network was young, but as more pipes hit end of life simultaneously, the reactive approach becomes a ticking time bomb of escalating costs and service disruptions.
What's needed is a risk based approach that targets intervention before failure, and that's exactly where AI becomes valuable.
The Process Piping Challenge Inside Treatment Facilities
While buried mains get most of the attention, process piping inside water treatment facilities presents a different but equally complex challenge. A large scale plant can contain thousands of individual pipe segments spanning tens of kilometres. These carry fluids that range from benign (drinking water, service air) through to genuinely hazardous (concentrated sulphuric acid, ferric chloride, sodium bisulphate).
Under AS 4343, each of these pipe segments is assigned a hazard level from A (most hazardous) to E (least hazardous), based on design pressure, pipe diameter, fluid toxicity, and operating conditions. In a typical treatment facility, the vast majority of pipework by length falls into Hazard Level E. But the smaller proportion in Levels B, C, and D carries disproportionate risk and demands closer attention.
Here's where it gets complicated. The risk profile of any individual pipe segment depends on a combination of factors:
- The process it serves,
- The material it's made from,
- The fluid it carries,
- Its physical size,
- The pressure rating, and
- The AS 4041 fluid classification.
When you combine these attributes into what we call "contextual strata," a plant with thousands of pipes can easily produce hundreds of unique risk contexts — each requiring its own failure analysis and treatment strategy.
Doing that manually is a monumental task. Doing it with data and Monte Carlo simulation? That's where things get interesting.
Where AI Fits In
AI and machine learning aren't magic bullets for pipe management, but they're exceptionally good at the things humans struggle with: processing vast datasets, identifying patterns across thousands of variables, and generating predictions that improve over time. For water pipe networks, the applications are genuinely compelling.
Predictive pipe failure modelling is probably the most mature application for buried mains. By combining pipe age, material type, soil conditions, pressure data, failure history, and even weather patterns, ML models can predict which pipe segments are most likely to fail next. Some implementations are achieving accuracy rates above 90% for identifying high risk sections. That means utilities can target their limited replacement budgets where they'll have the greatest impact on service reliability.
Leak detection is another area gaining traction. AI powered acoustic sensors and pressure analytics can identify leaks far earlier than traditional methods — before they become visible breaks. In Australia, undetected leakage accounts for billions of litres of treated water lost every year. Finding those leaks faster has obvious benefits for both costs and water security.
Demand forecasting uses ML to predict consumption patterns with greater accuracy, helping utilities optimise pressure management across the network. Getting pressure right reduces stress on aging pipes and extends their useful life — a relatively low cost way to defer expensive replacements.
CCTV and video analytics powered by AI can automatically classify pipe defects from inspection footage. What used to require an experienced operator watching hours of video can now be processed algorithmically, with consistent grading that removes human subjectivity. This is particularly valuable for sewer networks where CCTV inspection is routine.
Quantitative bow tie risk assessment — and this is the newer frontier — uses Monte Carlo simulation to model threats, preventions, consequences, and mitigations for process piping at scale. Rather than relying on static risk matrices, this approach samples from probability distributions to produce realistic cost and risk profiles for every pipe context in a plant. More on this below.
Quantitative Bow Tie Risk Assessment: A Better Way to Prioritise
Traditional risk assessment for process piping tends to follow a familiar pattern: convene a workshop, fill out a risk matrix, argue about likelihood and consequence ratings in a 5x5 matrix, record the results, and file them away until the next audit. The result is typically a static document that doesn't connect meaningfully to maintenance decisions or capital planning.
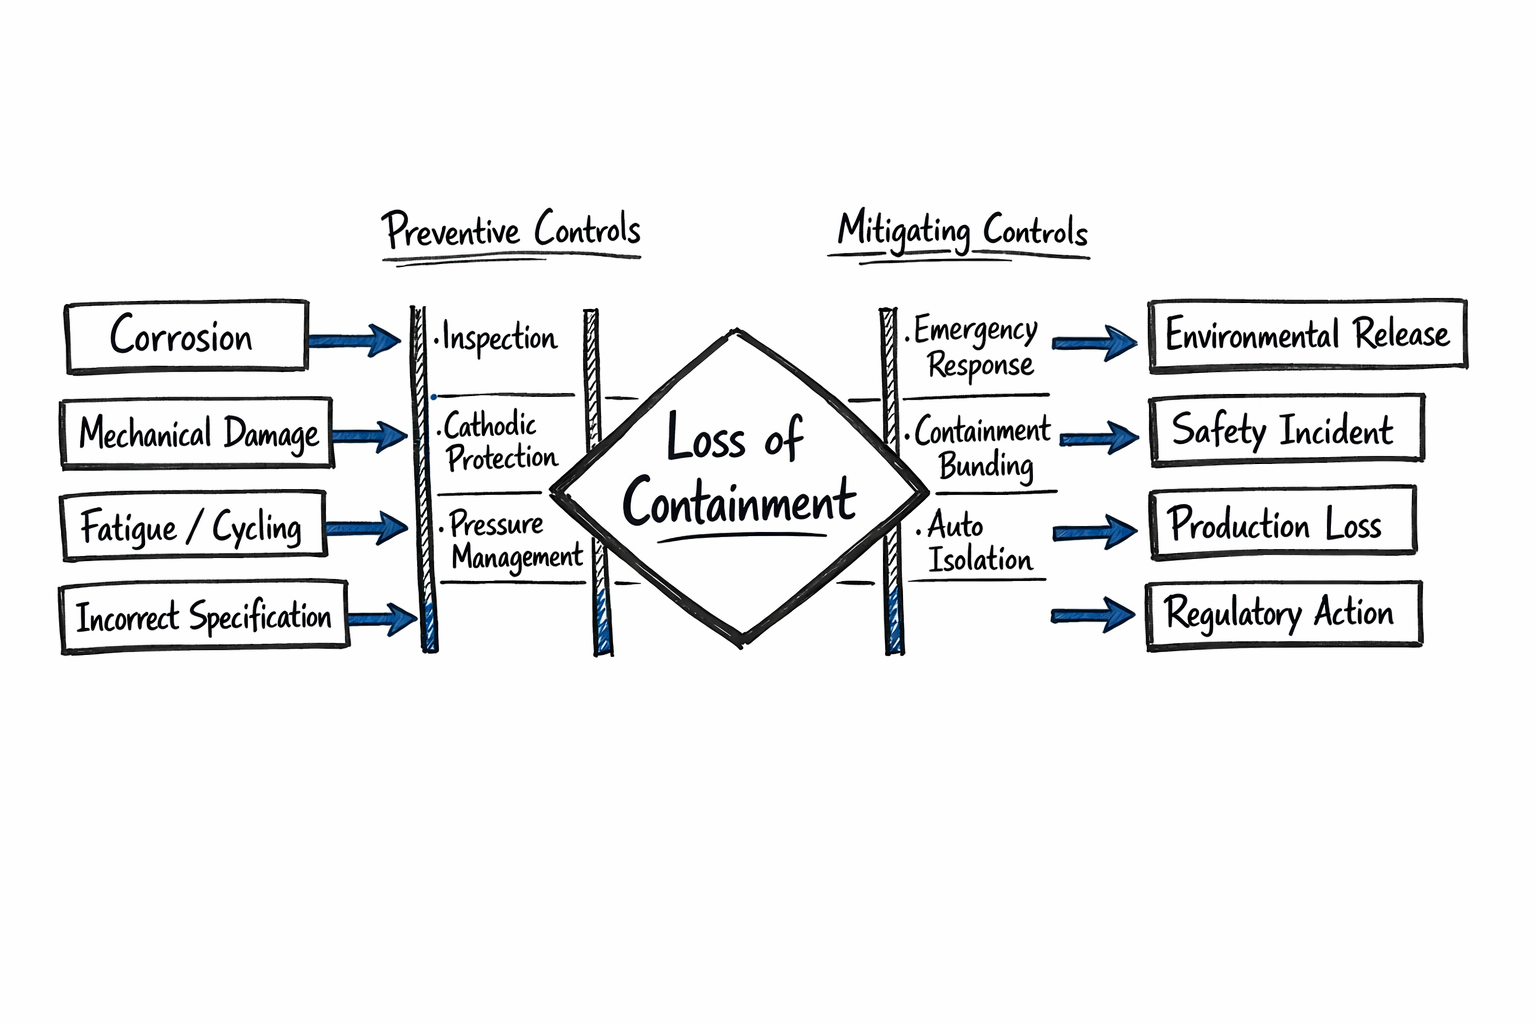
The bow tie methodology offers something fundamentally better. Originally developed in the oil and gas industry after the Piper Alpha disaster, bow tie analysis maps the full risk landscape around a central "top event" — in this case, loss of containment from a pipe segment. On the left side sit the threats (corrosion, mechanical damage, fatigue, incorrect specification) and the preventive barriers designed to stop them. On the right side sit the consequences (environmental release, safety incident, production loss) and the mitigating controls that reduce their impact.
What makes this powerful for process piping is the ability to apply it quantitatively at scale using Monte Carlo simulation. Here's how it works in practice.
First, you stratify the piping database. Every pipe segment gets classified by its contextual attributes: process area, material code, diameter range, fluid code, AS 4343 hazard level, AS 4041 fluid type, and length range. This creates a unique "context ID" for each combination — grouping pipes that share similar risk characteristics.
For each context, you then build a quantitative bow tie:
- Threats are modelled with probability distributions rather than single point estimates. Corrosion rates for polyethylene pipe carrying brine in a 100 to 300mm diameter range aren't the same as those for stainless steel carrying instrument air at smaller diameters. Each threat gets its own statistical model calibrated to the specific context.
- Preventive barriers — inspections, cathodic protection, pressure management, material upgrades — are assigned effectiveness distributions. A prevention doesn't simply "work" or "not work." It has a probability of success that varies based on maintenance quality, inspection frequency, and environmental factors.
- Consequences are costed using sampled distributions, not fixed values. The cost of a loss of containment event on a sodium hypochlorite line is fundamentally different from one on a service water line — and the actual cost in any given incident will vary. By sampling from realistic distributions (using parameters like mean cost and standard deviation per material and fluid combination), the model captures this uncertainty honestly.
- Mitigating controls on the consequence side — emergency response, containment bunding, automatic isolation — each get their own probability of success.
Run this model thousands of times via Monte Carlo simulation, and you get a realistic probability distribution of risk for every pipe context in the plant. Not a single number on a matrix. A distribution that tells you the expected annual cost of risk, the 95th percentile worst case, and — critically — which preventive investments deliver the greatest risk reduction per dollar spent.
From Theory to Treatment Strategy
The real power of this approach isn't the modelling itself — it's what you do with the results.
When you can quantify the expected cost of failure across hundreds of unique pipe contexts, you can answer questions that traditional risk assessment can't touch. Which 10% of your piping inventory accounts for 80% of your risk exposure? Where would an additional inspection cycle deliver the most risk reduction? Is it more cost effective to upgrade the material specification on a corrosion prone line or to increase its inspection frequency?
Worth noting: in a typical water treatment facility, the distribution of pipework across strata is far from uniform. Polyethylene and stainless steel typically account for the bulk of total pipe length, with PVC and polypropylene making up significant portions. The longest individual runs tend to be in primary treatment processes, while chemical dosing lines are shorter but carry higher consequence fluids. The Monte Carlo approach naturally weights risk by both the probability of failure and the exposure created by pipe length and fluid hazard.
This means your treatment strategy becomes genuinely risk based rather than compliance driven. Instead of inspecting everything on the same cycle, you target resources where they demonstrably reduce risk. Instead of replacing pipe based on age alone, you replace it based on quantified expected failure cost. And instead of presenting the board with a qualitative heat map, you present them with a dollar figure and a confidence interval.
Why Condition Assessment Alone Isn't Enough
Many utilities have invested in condition assessment programmes — and rightly so. Physical inspection of water mains, sewer rising mains, gravity mains, reservoirs, and process piping provides invaluable data about the actual state of assets. Some programmes have assessed hundreds of kilometres of pipework, identified tens of millions in planned renewals, and enabled long term capital planning informed by real condition data rather than age based assumptions.
That work is genuinely important. But in 2026, physical inspection alone isn't a complete strategy. Inspecting every pipe in a network is neither financially viable nor practically necessary. What AI enables is the ability to prioritise where to inspect, predict what you'll find, and continuously update risk profiles as new data arrives. Condition assessment becomes an input to the model, not the entire strategy.
The organisations that will lead in pipe management are the ones combining traditional condition assessment with AI driven analytics — using physical inspection data to train and validate models that then extend intelligence across the entire network.
The Data Foundation You Can't Skip
None of this works without good data. And this is where most utilities get stuck.
For buried mains, AI models need at minimum: accurate asset registers with pipe material, diameter, and installation dates; georeferenced failure and repair history; soil and environmental data; pressure and flow records; and ideally condition assessment results to validate against.
For process piping, the data requirements are different but equally demanding. You need a comprehensive piping register with material codes, diameters, lengths, fluid classifications, and design parameters. You need AS 4041 and AS 4343 classifications for every segment. You need failure history linked to specific pipe contexts, and cost data granular enough to build meaningful distributions for your Monte Carlo models.
What we've found is that many utilities have significant gaps in this foundational data. Installation dates for older pipes are often unknown or unreliable. Failure records may exist in different systems or lack detail about root cause. And spatial data quality varies widely. For process piping, the piping register is often incomplete or out of date, with as built drawings not reflecting modifications made over years of operation.
The honest answer is that getting data right isn't glamorous work, but it's essential. Before investing in AI platforms, utilities should audit their data quality, identify critical gaps, and establish consistent data capture processes. An 80% data quality threshold is a reasonable target before ML models start producing useful results.
Getting Started: A Practical Approach
For water utilities considering AI for pipe management, here's our recommended approach.
Start with a clearly defined pilot, not a network wide transformation. For buried mains, pick a specific problem — like predicting failures on a particular material cohort (say, cast iron mains over 60 years old) or automating defect classification from existing CCTV footage. For process piping, start with a single facility and build the contextual stratification framework before attempting to model the full bow tie.
Build the data foundation in parallel. Use the pilot to identify exactly what data you need and what gaps exist. Invest in fixing those gaps as part of the project, not as a separate prerequisite that never gets funded.
Partner with people who understand both the technology and the operational reality. AI vendors who don't understand how a water utility actually operates will build models that look good in presentations but don't survive contact with the real world. Similarly, quantitative risk modellers who haven't spent time understanding AS 4343 classifications and the practical realities of process piping maintenance will produce outputs that compliance teams can't use.
And measure outcomes relentlessly. Track whether the model's predictions actually align with what happens in the field. Measure the cost of intervention versus the cost of failure. Build the evidence base that justifies scaling up.
What Comes Next
Australia's water infrastructure challenge isn't going to solve itself. With aging networks, growing populations, and climate variability putting more stress on both buried and above ground assets, utilities need better tools for deciding where to spend limited capital.
AI powered pipe management isn't theoretical anymore — it's being deployed internationally and in pockets across Australia. The convergence of predictive analytics for buried mains with quantitative risk modelling for process piping gives utilities a comprehensive toolkit for managing their entire piping portfolio on a genuinely risk informed basis.
The question isn't whether AI will transform pipe network management. It's whether your organisation will be leading the change or playing catch up.
If you're interested in how AI and quantitative risk modelling can improve your pipe network management, get in touch to start a conversation.

Ageing Utility Assets Are Rewriting the Maintenance Service Model