Transforming Asset Data from Chaos to Clarity at GeelongPort
How SAS-AM helped GeelongPort transform a fragmented Maximo asset hierarchy into a consistent, scalable foundation for advanced asset management.
.jpg)
The Challenge
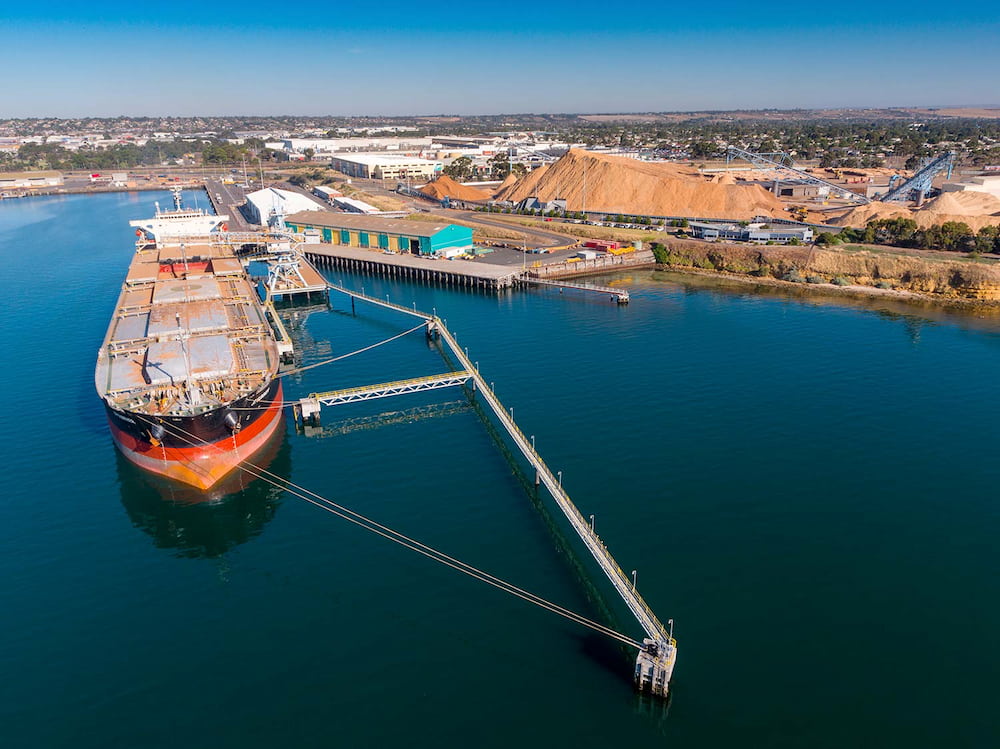
GeelongPort operates one of Victoria's most significant commercial ports, managing a diverse portfolio of wharves, piers, and supporting infrastructure across Corio Bay. Like many asset-intensive organisations, they'd accumulated years of data across multiple systems—and it showed.
Their asset hierarchy had grown organically over time, absorbing information from Maximo records, condition assessment reports, legacy spreadsheets, and internal documents. The result? A fragmented dataset that made even basic questions surprisingly difficult to answer.
Here's what we found when we started digging:
The same asset type might be named three different ways depending on which wharf it sat on. Parent-child relationships were inconsistent—a mooring dolphin might sit at the same hierarchical level as an individual pile. Approximately 10,000 of the 12,000 assets had naming conventions that were either confusing, duplicated, or too generic to be useful. And 305 assets existed as 'rogues'—floating in the system without any valid parent assignment.
The practical impact was significant. Maintenance planners struggled to locate assets. Condition data from recent inspections couldn't be reliably matched to Maximo records. Financial reporting risked overstating the asset portfolio through redundant entries. And any attempt at advanced analytics or predictive maintenance was hampered before it could begin.
GeelongPort needed more than a cleanup—they needed a complete structural rethink that would support their operations today and scale for the future.
The Approach
We started where good asset management always starts: understanding what actually exists.
An exploration day with GeelongPort's team gave us the operational context that spreadsheets alone can't provide. We walked through their Maximo environment, discussed how different teams interact with the data, and identified the specific pain points that mattered most to daily operations.
From there, we undertook a systematic classification of every asset. Each record was tagged with its appropriate functional group, asset class, and location—revealing just how far the existing structure had drifted from any consistent logic.
The condition assessment reports proved invaluable. These detailed inspections of structural elements gave us a ground-truth benchmark: what assets actually exist, where they sit, and how they relate to each other. Cross-referencing Maximo against these reports exposed gaps, duplicates, and misalignments across every wharf.
We developed a standardised functional group structure applicable across all sites:
- Access Structures (stairs, ladders, catwalks, platforms)
- Berthing and Mooring (dolphins, fenders, bollards)
- Wharf/Pier Structure (piles, beams, crossheads, deck elements)
- General Infrastructure (buildings, roads, land assets)
- Services (electrical, water, stormwater, communications)
- Fixed Plant (where applicable)
- Mobile Plant (fleet-wide)
Each functional group received its own naming convention—consistent enough to enable automation and searchability, flexible enough to accommodate the unique characteristics of different sites.
To visualise the emerging hierarchy in real-time, we built a Python-based tool that rendered the structure as we worked. This let us spot inconsistencies immediately rather than discovering them weeks later during upload.
Every asset was assigned a processing status (incomplete, verification, complete) and change type (removed, unchanged, edited). For structural elements, we attached Unique Element Identifiers (UEIs) drawn directly from condition assessments—creating a direct, auditable link between field inspection data and system records.
The Outcome
Across the project, we reviewed and assessed more than 25,000 assets.
The numbers tell part of the story: from an original dataset of 11,761 assets, we removed 6,832 redundant or incorrect records, reviewed and edited 4,929 existing assets, and created 13,342 new records (including 12,724 derived from condition assessment data). The resulting hierarchy contains 18,271 assets—each with a clear parent, consistent naming, and traceable documentation.
But the qualitative improvements matter just as much. The hierarchy is now intuitive to navigate. Assets can be found through logical drill-down rather than keyword guessing. Condition data from future inspections can flow directly into Maximo without manual reconciliation. And the standardised structure provides a foundation for maintenance optimisation, risk analysis, and renewal forecasting.
The work positions GeelongPort to move from reactive data management toward predictive, analytics-driven asset planning.
Key Lessons
- Condition data is your best friend. Engineering inspection reports contain the ground truth about what actually exists. When Maximo says one thing and the condition report says another, trust the people who were physically looking at the asset.
- Naming conventions need to be human-readable AND machine-processable. A description like 'CQN1-15A Pile' tells you nothing without tribal knowledge. 'CQN1 – Wharf – Pile – Bent 15 – Row A' can be understood by anyone—and parsed by any system.
- Visualise as you go. Building a hierarchy in spreadsheets alone means you won't see structural problems until upload. Real-time visualisation caught dozens of issues that would have been painful to fix later.
- Start with one location and get it right. We built out Corio Quay North first, refined the approach, then applied it consistently across remaining sites. This prevented us from propagating early mistakes across the entire portfolio.
- Data cleanup isn't glamorous, but it's foundational. Every advanced capability—predictive maintenance, risk-based planning, AI-powered analytics—depends on having reliable, well-structured data underneath. There are no shortcuts.

AI in AM Weekly — Vendor Risk Week (4 May 2026)
