
Asset Condition Rating Methodology — 1 to 5 or 1 to 100?
A practical guide to asset condition rating methodologies. Covers how to design standardised rating scales, distinguish between simple and complex assets, implement consistent field assessments, and use condition data for renewal planning.
.jpg)
# Asset Condition Rating Methodology — 1 to 5 or 1 to 100?
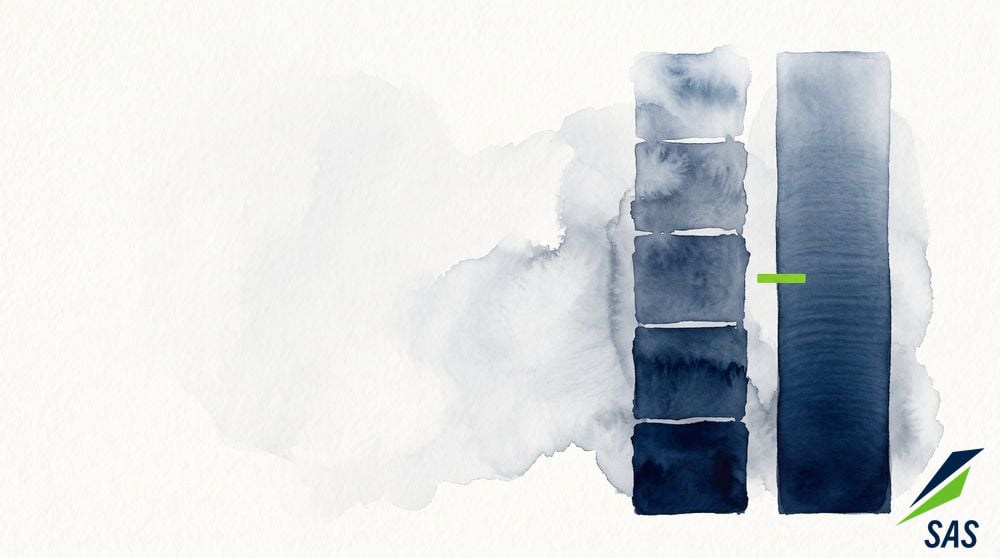
A condition scale is not a label. It is the resolution of your vision — the finest change in an asset you are able to see and act on. Choose five levels and you have decided, before a single inspection, that anything smaller than a fifth of an asset's life is invisible to you.
That is a bigger decision than most organisations realise they are making. So it is worth making it on purpose.
The 1 to 5 scale: standard, and quietly limiting
The 1 to 5 scale is the default in Australian practice, aligned with the International Infrastructure Management Manual and adopted across local government, water and transport.
- 1 — Very Good: new or recently rehabilitated, no defects, full life remaining.
- 2 — Good: minor deterioration, cosmetic only, roughly 60 to 80 per cent of life remaining.
- 3 — Fair: moderate deterioration, some components nearing end of life, 30 to 60 per cent remaining.
- 4 — Poor: significant deterioration, major work needed within one to three years, 10 to 30 per cent remaining.
- 5 — Very Poor: failed or imminent, immediate intervention, under 10 per cent remaining.
Its strengths are real. It is simple, everyone already speaks it, and you can train an assessor to use it in an afternoon. For a board report or a portfolio heat map, it is exactly right.
The weakness is just as real, and it hides in plain sight. Each grade is a bucket that spans decades of asset life. A "3" covers everything from thirty per cent remaining to sixty. An asset can degrade for years and never move off that number — and then jump a whole grade in a single inspection, which reads as a sudden failure when it was a slow slide you simply could not see. In our experience that is where condition based planning quietly breaks: not because the data is wrong, but because it is too coarse to show movement, and movement is the thing you act on.
Put plainly, 1 to 5 tells you an asset is worn. It does not tell you it is moving. And it clusters — ask any team and most of the portfolio sits on 3, because the middle bucket is enormous and the definitions leave room to round toward it.
The 1 to 100 scale: resolution, if the data earns it
A 1 to 100 scale, or a continuous percentage, gives you back the thing five levels throws away: gradient.
- You see drift. Year on year an asset moves 74, 71, 67 — a trajectory you can extrapolate, rather than a flat "3" that tells you nothing until it snaps to "4".
- You can set thresholds that mean something. Intervene at 40, inspect more often below 55, review the strategy under 30 — decisions with an edge, not a grade with a range.
- It feeds the models. Deterioration curves, remaining useful life and risk ranking all want a continuous input. Feed them a five point step and you are modelling a staircase; feed them resolution and the forecast has somewhere to stand.
- It stops the clustering. When the scale has room, assessors stop rounding everything to the middle.
There is an honest caveat, and it matters more than any of the above. A 1 to 100 score on eyeball data is a lie. Precision you have not earned is worse than an honest coarse grade, because it invites decisions the underlying assessment cannot support. A 100 point scale is only worth having when the method behind it produces that resolution — measurement, testing, structured defect indicators, or a defensible scoring rubric — rather than a number an inspector felt. The granularity has to come from the assessment, not from the spreadsheet column being wider.
Which one, and when
This is not a contest with a single winner. It is a matter of matching the scale to the decision and to the data underneath it.
The practical answer most mature organisations land on is both, on purpose. Capture and decide at high resolution; report at 1 to 5. Assess to a 100 point or component weighted score where the decision and the data justify it, keep that resolution for planning and analytics, and map it up to the familiar five grades for stakeholders who need the headline, not the gradient (80 to 100 becomes a 1, and so on). You lose nothing in the boardroom and you keep everything in the model.
And note where the finer scale comes from naturally: the moment you separate severity — how bad a defect is — from extent — how much of the asset it affects — you are already past five levels. Two numbers multiplied give you a far richer, higher resolution picture than any single grade, and it is defensible because each part is observable.
Making higher resolution real
Resolution is earned in the field, not declared in the methodology. The scale only means what the assessment behind it can support.
- Simple assets — a road segment, a fence, a pipe length — carry a single overall condition, scored against visible deterioration indicators.
- Complex assets — pump stations, bridges, buildings — need component level assessment with weighted aggregation, which is itself a finer scale by construction.
- Field protocols decide whether your numbers are trustworthy: scope and boundaries, method (visual, measurement or testing), data capture with defect descriptions and photographs, and a frequency set by criticality and how fast the asset degrades.
- Digital capture with structured entry, validation rules and geotagged photographs is what makes a 100 point score honest rather than free text guesswork, and lets a supervisor calibrate assessors against each other.
- Training and calibration — multiple assessors scoring the same asset and comparing — is non negotiable at higher resolution, because a finer scale exposes disagreement a coarse one would have hidden.
Where condition data has to land
None of this is worth the effort if the number sits in a spreadsheet. Condition has to flow into the decisions it is meant to inform — remaining useful life, risk based renewal prioritisation, deterioration modelling, and valuation under the Australian Accounting Standards — and it has to live in the asset management system (Maximo, SAP, TechnologyOne) against consistent asset identifiers, with history retained so you can see the trajectory, not just today's snapshot.
And keep the wider frame in view: condition is only half of a risk calculus. A high resolution condition score earns its place in a strategic decision only when it is paired with the consequence of the asset failing. Resolution on one axis, with none on the other, is still half an answer.
Getting started
Start from the decision, not the scale. Ask what you are trying to decide — a renewal programme, an intervention threshold, a capital submission — and how much resolution that decision actually needs. Then design the assessment to produce it honestly, and report it in whatever grade your audience understands.
SAS-AM helps organisations design condition rating methodologies that match the scale to the decision, build the field protocols and digital capture that make a finer scale trustworthy, train and calibrate assessors, and wire the result into the systems and models where it earns its keep.
Talk to us about a condition rating approach that shows you movement, not just wear.